How to analyze NPS responses

Integrate your NPS survey software with Zapier
The easiest and recommended way to import your NPS responses is through Zapier. With a free Zapier account, you can connect apps together and move data around using automated workflows called Zaps.
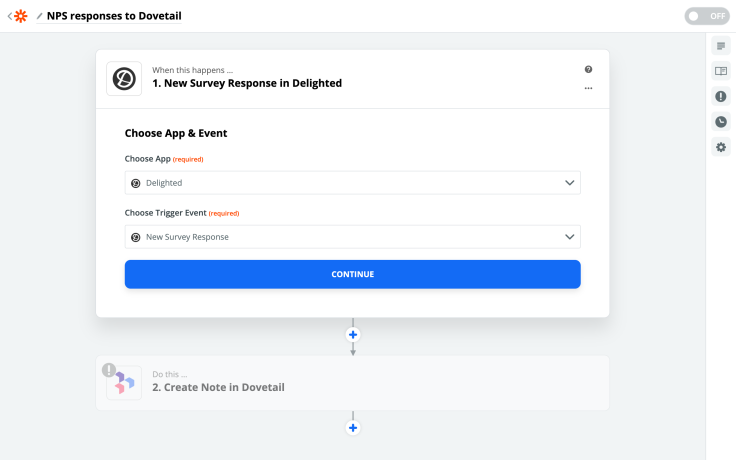
Creating a Zap for your NPS app
Start by connecting your NPS survey software to Zapier. Once connected, you’ll need to create a new Zap, and select the relevant Trigger from your NPS app. Here are quick references to some of the more popular NPS apps:
Delighted: use the New Survey Response trigger to.
Wootric: use the New Response trigger to. You also use the Detractor Response or Promoter Response triggers to filter more granularly.
AskNicely: use the New Response trigger to.
Promoter.io: use the NPS Score Changed trigger to.
For this example, we’ll look at creating a Trigger using Delighted.

Once you’ve configured your Trigger, you’ll need to set up the Create Note Action. For this example, we want our notes to be created in a new project called NPS responses within the Uncategorised group.
We want the title of the note to be populated with the Person Name from Delighted. The content of the note will be the NPS survey Comment.
We’ve also created fields for Score, Email, and Permalink, which we’ll populate with the respective values from Delighted.
We’ve also set Analyze sentiment to yes, which we’ll explore later in this guide.

Once you’ve set up your Zap and turned it on, any new responses from your NPS survey software will start creating new notes in Dovetail. If you’re looking to retrospectively analyze data you’ve already collected, you can use CSV import.
Option 2 - Import NPS responses from a spreadsheet (CSV)
If you don’t have a Zapier account, you can manually export your data from your NPS survey software and import it into Dovetail.
The disadvantage of this over Zapier is that you will have to manually export and import to get the latest data into Dovetail, whereas Zapier will continuously push your data into Dovetail as it is collected.
Export data as a CSV from your NPS survey software
Here’s how to export your data from some of the most popular NPS survey software:
Import your data into Dovetail
Once you’ve exported your data, you can import your exported CSV file into Dovetail to create new notes for each survey response.
Using sentiment analysis to automatically categorize your NPS responses
When you’re setting up your Zap, or manually importing from CSV, you can enable Sentiment analysis.
For each NPS survey response, Dovetail will add Positive and Negative tags to sentences in notes that express a strong positive or negative sentiment. Learn more about sentiment analysis. Quickly get a picture of the number of positive or negative comments in your NPS responses by showing sentiment tags in Charts.

Structuring your project in Dovetail
You’ve set up Zapier and have your responses flowing into Dovetail, or you’ve imported your NPS responses manually. Now it’s time to do some analysis.
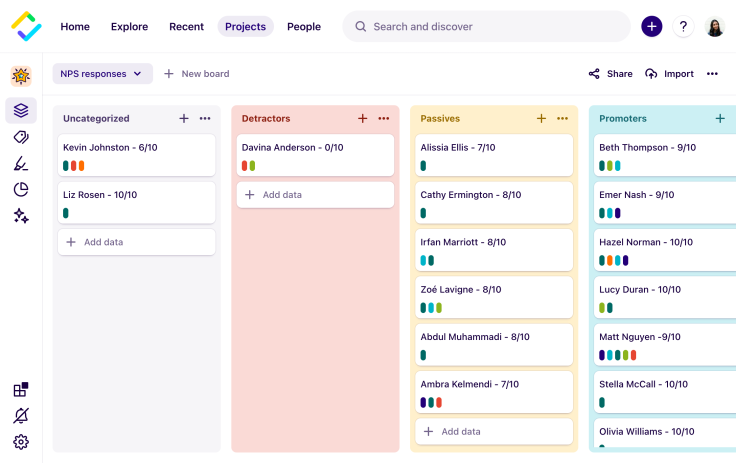
The first group in our project is Uncategorised. This is the group where all of our responses will be created in from Zapier. Because they’re in this group, we know that they need to be analyzed.
We’ve also created groups for Detractors, Passives, and Promoters. Once a note has been analyzed, we’ll move it into a group based on the score given on the survey. We’re choosing to group by the score here, but you can explore grouping by a taxonomy that’s more relevant to you, like customer segment, product, or user type.

To analyze a note, open it up and add any relevant tags. In this example we’re going to tag part of this comment with Performance / Scale.
Dovetail’s sentiment analysis has automatically tagged parts of the comment as Positive or Negative.

You could also workspace fields and tags to your NPS project, allowing you to select tags from across projects. For example, you might have workspace tags set up for features in your product. You could connect it to your NPS project and tag mentions of features in NPS survey responses.
Quantifying NPS themes with charts
Once you’ve analyzed your NPS responses, use Charts to quantify how frequently problems or product areas are mentioned by your customers.
Charts are great for getting a quick view of the themes, features and areas that are responsible for affecting your NPS score.

Publishing monthly or quarterly insights from NPS
Once you’ve got your NPS analysis workflow nailed, you might want to consider summarizing the most prominent or recurring themes each month or quarter.
Publish your findings from analysis with the insights feature, and share your lessons with all the stakeholders in your organization.
A whole new way to understand your customer is here
Log in or sign up
Get started for free
or
By clicking “Continue with Google / Email” you agree to our User Terms of Service and Privacy Policy


