How to create engaging research reports

Anyone who conducts research needs a formalized way to share the output of research with stakeholders. This usually takes the form of a research report. Reports are a great way to summarize key findings from a research project, influence a product roadmap, build customer empathy, share customer insights across the organization, and—on a meta-level—they are an important way for researchers to evangelize the value of customer research.
We think great reports are:
Visually appealing
Engaging, with lots of different media
Collaborative
Linked to supporting evidence
Full of actionable insights
In this guide, we're going to show you how you can use insights to create stunning reports in Dovetail that capture all your important customer knowledge in an evidence-backed, actionable manner.
Who this guide is for
This guide is suitable for anyone looking to share the output of their research with their teams or the wider organization. A few examples of roles that could benefit include:
Researchers looking for a compelling way to share the outcome of their research projects with stakeholders
Designers looking for a way to present design research to their team
Product managers looking to compile research around a theme or topic (for example a bug, or a roadmap decision)
What kinds of reports can you create in Dovetail?
Dovetail insights are flexible enough to accommodate a multitude of reporting styles and topics. Beyond reporting the latest findings from a research project, Dovetail users can build insights to report on:
Key customer personas. Link your personas to video highlights of real customers to help bring them to life
Cross-project customer insights. You can pull insights from research conducted by other teams in your organization and use them to bolster your own findings
Existing customer knowledge for onboarding new colleagues. Round up the latest and most important customer insights to get new team members up-to-date, eliminating the need to repeat the same research every time a new colleague joins
Ongoing customer pain points about product features. Drive empathy and keep your team motivated to solve customer problems by sharing a collaborative and engaging report featuring real customer highlights
Anything requiring a thematic grouping of past or present research
How to create awesome reports using insights
Insights is a feature that treats source data traceability and dynamic storytelling as first-class concepts. You can gather cross-project insights using insights and create reports that are more collaborative than your average report and flexible enough to cater to a wide variety of reporting styles.
If you're conducting research and looking to create engaging, well-sourced, collaborative reports that stakeholders will want to read, then follow these steps to get started.
Create an executive summary
Use the text styling options from the block editor toolbar to create an executive summary to introduce the background of your research.
Draw your readers in right at the start
The best reports provide the reader with something valuable right away, encouraging them to read on and dig deeper. What better way to capture the attention of your stakeholders than with a broad action-inspiring insight backed by Dovetail video highlights of users speaking about the subject at hand?
Add more insights
Create a title for each insight with the text editor tool. Use colored cards from the block editor toolbar to call attention to the relevant details of your insight. Back it all up by adding the project insight itself and select video highlights of users describing the problem.
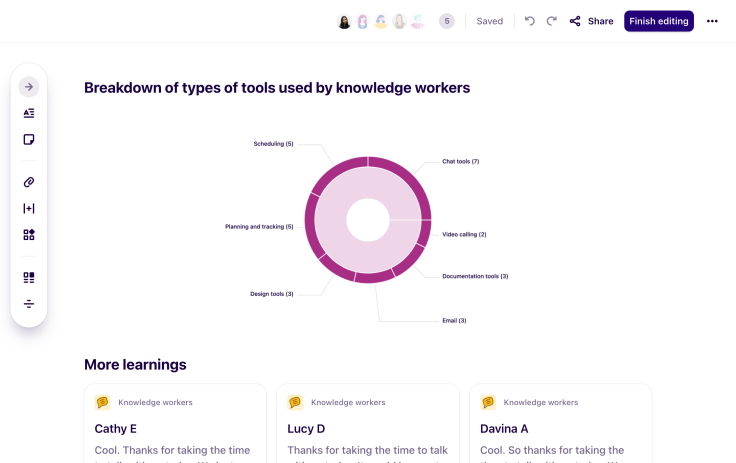
Add quantitative data to your report
Charts, graphs, and tables can be downloaded from Dovetail and dropped into the insights block editor. Likewise, any images or data you have outside of Dovetail can be added the same way.

Keep it fresh with different formatting options
No one likes boring, one-dimensional reports. Try experimenting with your layout by adding or taking away columns and dragging and dropping block objects to curate your findings in several visually appealing ways.
Provide quick context for further investigation
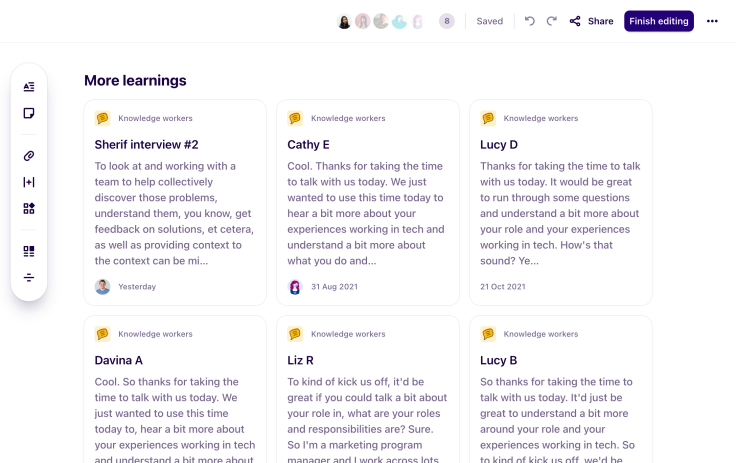
Add a custom search block to provide a research feed that updates every time someone loads the page and configure your search to include any relevant information.
Using the lightning icon, you can use predefined searches by selecting from templates we provide (such as ”projects you’re working” or “recently published insights”) or a custom search based on your own configurations using the gear icon. For example, if you’ve recorded specific values in your fields (like usability scores or role types) you can filter by those values and create a research feed full with cross-project data.

Where to find insights
It’s important that anyone interested in finding relevant customer knowledge can uncover them with minimal guidance. To this end, we’ve introduced a “Recent” tab that allows all user roles to find insights.
Insights are also discoverable using global search, which can be filtered by insights, and through the “Explore” tab.
Create a research report in Dovetail today!
Use the information in this guide as a launch point. In no time, you'll be creating awesome reports to share with the whole organization.
A whole new way to understand your customer is here
Log in or sign up
Get started for free
or
By clicking “Continue with Google / Email” you agree to our User Terms of Service and Privacy Policy


